Product Page: https://www.zenplot.com/en
ZENPLOT, the data visualization software dedicated to advanced graphics
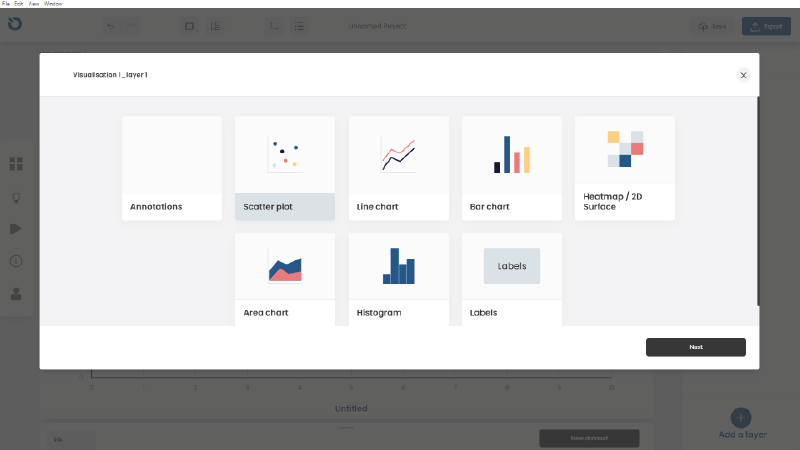
ZENPLOT allows you to create impactful visualizations by stacking different graphic layers (histograms, scatterplots, line charts, bar charts, heatmap / 2D surface, area chart, labels, annotations, axis, legend etc.). The data can be linked to any characteristic of the different layers (color, shapes, etc.).
The user also has the option of annotating visualizations with images, text or shapes while navigating through a user-friendly interface. Each graphic is then exportable to vectorial or standard format.
ZENPLOT is available on PC and Mac, and its simple and intuitive interface requires very little learning.
Your visualizations can be exported in different formats (.PNG, .SVG, et cetera) so that you can include them in presentations. You can also share your projects and visualization templates simply by saving them in the .ZEN format.
A project can be made up of one or more visualizations, which in turn are made up of one or more layers linked to one or more datasets.
Each feature of each element of the visualization can be customized. (for example: size, color, shape of a point). There are two ways to do this: uniformly for the layer or by linking it to a variable.
ZENPLOT integrates different themes that will allow you to style visualizations in the blink of an eye.
In ZENPLOT, you can annotate your visualization with shapes , texts, or images for a maximum of creative freedom. You can also customize to a high degree the reading axes and the legend of the visualization.